
How the Xandar Kardian XK300-H offered clarity during the final stage of one man's life, at his own request, and what the same readings looked like across hundreds of journeys in long-term care. Every figure from the white paper is here, redrawn.
This is a retrospective case study and cohort analysis published by Xandar Kardian in 2025, with the family's wishes honoured. "Days before" is the interval between a shift in a person's own readings and the day of death, measured afterwards. It is part of an ongoing discovery and research programme, and we show what we found. It is not a claim that any Kardian product detects or predicts death or decline, and no such use is cleared. XK does not predict or diagnose health events. The later February 2026 analysis, across 390 journeys, put the average at 6.3 days.
After being diagnosed with advanced pancreatic cancer, Rod M. chose to return home to spend his last moments surrounded by family. For two weeks he was monitored continuously with the XK300-H radar sensor, which quietly recorded his breathing, heart rate, movement and sleep without ever disturbing his rest. Honouring his wish, this case study shares those observations so that his experience may inform future care and bring clarity to others at the same stage of life.
Six days before his passing, marked changes became visible: sleep extended to nearly 20 hours a day, breathing rate dropped below 12 breaths per minute, and heart rate rose well above his usual range. Other measures, such as the variability in breathing, the estimated airflow and the breathing waveform, also shifted in measurable ways.
What was seen in this case reflects what has been seen in more than 300 other journeys captured by the same device in long-term care. Clear signs of decline were present in about four in five, with notable changes in breathing or heart rate appearing on average more than five days before death. A consistent pattern that can give families and caregivers meaningful time to prepare.
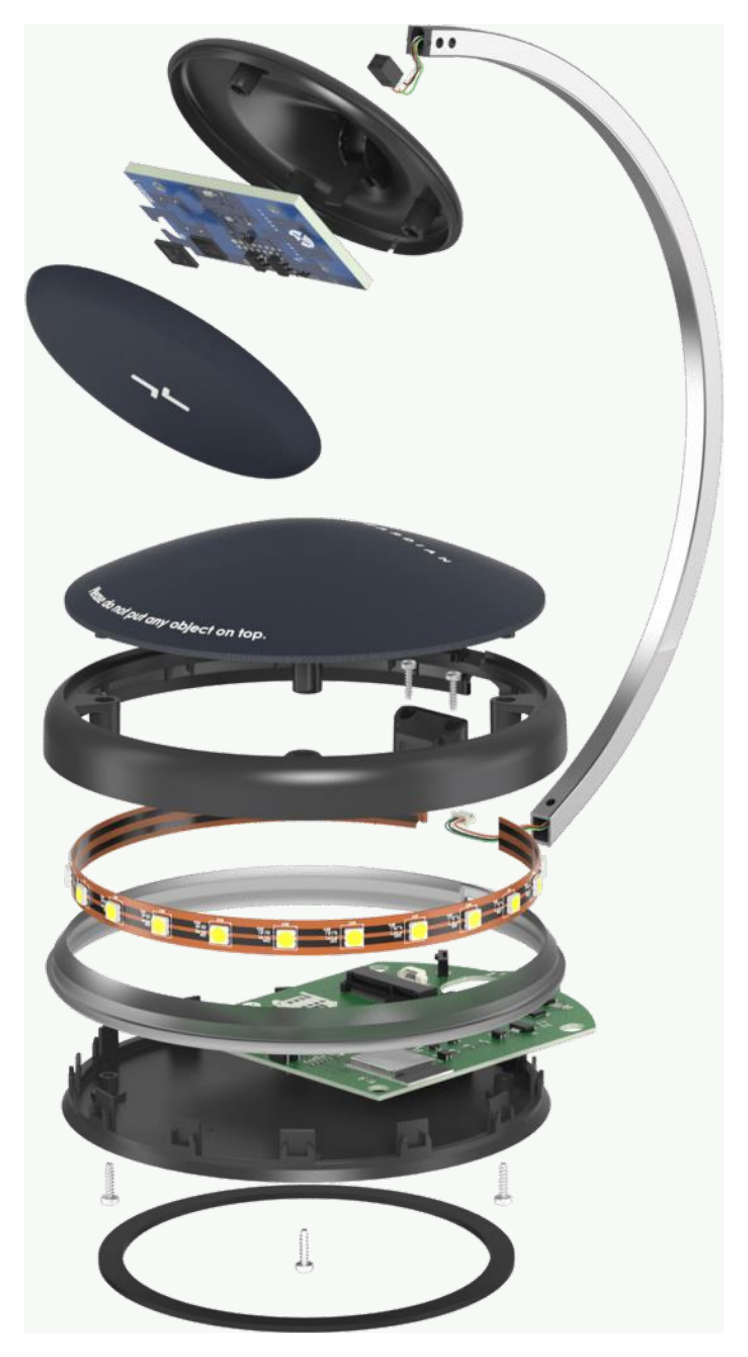
Xandar Kardian XK300-H, the tabletop form of the XK300 vital-sign sensor.
"Rod's story stands as a testament to the integrity of his vision and to the real impact of the technology he believed in; not just professionally, but personally. In his final days, the Xandar Kardian sensor provided the very information and support he had long advocated for, transforming the way care is delivered."
Brittany Jefferson, Chief Commercial Officer, Rosie Connectivity Solutions
At the end of life, the focus of care shifts from intervention to comfort. Because vital-sign monitoring has traditionally been linked to medical procedures, its use in hospice may be perceived as prolonging discomfort rather than easing it.
Applied thoughtfully, continuous, contact-free monitoring can provide a different kind of value. Instead of signalling when to intervene, it offers a quiet awareness of change, capturing subtle shifts and unspoken needs that help caregivers know when comfort measures are needed most.
This approach is unobtrusive: no wires, wearables or physical contact. By observing gently and continuously, monitoring can bring clarity to families, guide caregivers in preparing for what is to come, and help ensure that the final days remain peaceful.
End-of-life care is as much about the family as it is about the patient. It is a time of uncertainty and heartache, for loved ones and for the caregivers who stand alongside them.
Hospice organisations walk a delicate line: honouring dignity and comfort through responsive care planning while managing limited staff and resources. Radar can support both sides of that mission.
The XK300 is a health-monitoring device that passively measures vital signs by detecting subtle chest and body micro-movements. It captures thousands of data points a day using safe, ultra-low-power radar signals. No wires, wearables or maintenance: set it up and let it run in the background.
The XK300 is ideal for professional care settings, and is also available in the XK300-H form factor, better suited to residential use. Both use the same radar technology and measurement capabilities; the XK300-H is designed for an even simpler set-up, supporting wall-mount and tabletop installation. Portable and flexible, it moves wherever it is needed.
The XK300 is a Class II medical device, FDA-cleared (510(k) K202464) for measuring heart rate and breathing rate in adults. Everything else on this page, including sleep, movement, breathing variability, airflow and baseline change, is shown as research and is not a cleared measurement. How accuracy was validated.
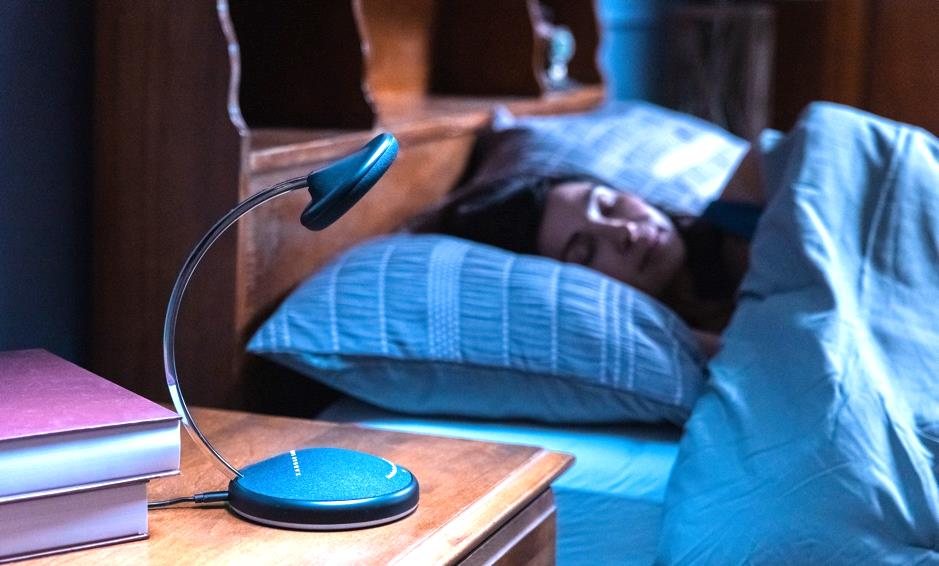
The XK300-H on a nightstand. In Rod's home it sat by the bed for fifteen days.
Resting heart rate · resting breathing rate · movement · bed presence · sleep · changes from the person's own baseline (PoBC).
Nothing to interact with · no cameras, no microphones · about 6,000+ resting heart-rate and breathing readings a day, continuously.
Rod M. dedicated his career at Rosie Connectivity Solutions to developing technologies that supported caregivers, reduced the burden on families and improved patient care. His work reflected a belief that healthcare should be safer, more compassionate and centred on the people it serves. He set a standard that continues to shape the future of care.
In January 2025, Rod was diagnosed with stage IV pancreatic cancer. Four months later he chose to spend his last days at home, surrounded by family and comfort. As the end approached, Rod expressed his wish to be monitored by the Xandar Kardian sensor, so that both XK and Rosie could learn from his experience and ease the path for those who would follow. For two weeks the XK300-H quietly captured his vital signs, bearing witness to his final journey.
"Rod's legacy at Rosie lives on through Xandar Kardian. Together, we carry forward his mission: technology that dignifies care, eases burdens, and honours every patient's final moments."
Brittany Jefferson, Chief Commercial Officer, Rosie Connectivity Solutions
D is the day Rod passed. D-7 is seven days before; D-14 fourteen days before.
The XK300-H in Rod's home monitored vital signs and movement continuously and passively, with nothing asked of him or his caregivers. Over two weeks that amounts to about 95% monitoring time, the remaining 5% explained by unplugging or absence.
The sensor analyses subtle body motion to capture overall stillness. It showed a steady decline in movement variability over the two-week period. In the final days Rod was nearly motionless, a pattern associated with decreased consciousness near the end of life (1).
Sleep is estimated from patterns in breathing and movement. It rose steadily over two weeks, reaching more than 20 hours a day on D-4. Along with reduced movement, this is another hint of reduced consciousness: as death approaches, people often appear asleep or half-awake, though they may still hear others (2).
The XK300-H monitored continuously for 15 days, averaging 8,000 resting heart rates and 10,000 resting breathing rates a day. Over this period movement steadily declined and sleep increased to more than 20 hours a day, signs associated with reduced consciousness in the final days of life.
The radar measures breathing rate by tracking chest movement. Breathing rate is a key indicator of health and an early marker of decline (3); abnormal values are strongly linked to a higher risk of intensive-care admission and in-hospital mortality (4).
The chart shows a steady decrease in daily breathing rate over the fourteen days, from about 16 to 9 breaths a minute. Around D-7 it dropped below the usual adult range of 12 to 20 and stayed low until passing.
Unlike a spot check or a wearable's daily average, the XK300 captures breathing thousands of times a day, so the full distribution can be seen. Across three windows, first five days, next five and final five, the average fell and the spread narrowed. At the start, about 16 with a wide spread, healthy variability: lower at rest, higher with activity. Then the distribution tightened, suggesting reduced adaptability. In the final days breathing became uniform and inflexible, the body's declining ability to adjust to internal demands (5, 6).
Airflow is estimated from chest movement and breathing rate, adding depth beyond the rate alone. Slower but deeper breaths can sometimes maintain oxygen intake; here the estimate fell by nearly half over two weeks, meaning both rate and volume declined, a marked loss of respiratory capacity.
Breaths per minute. The spread narrows and the centre falls: about 16 at first, about 10 in the final days.
Breathing rate fell from 16 to 9 breaths a minute, dropping below the usual range a week before death. Variability disappeared and the estimated airflow halved: a marked loss of respiratory capacity and adaptability.
Beyond the average rate, the XK300 captures the full breathing waveform: inhalation, exhalation and the pauses between breaths. This cycle-by-cycle view reveals patterns such as pauses or phase imbalances that averages cannot show (7).
A normal cycle. The first drawing shows a healthy example with its three phases.
A long pause. The second shows a pause between breaths lasting eight seconds. Such events are only visible with waveform-level analysis and, when frequent, are described in the literature as early signs of respiratory failure, even while the overall rate stays within normal limits (7, 8).
Longer inhaling. The third shows the balance between inhaling and exhaling shifting in Rod's final week. Normally inhaling takes a little longer than exhaling (9); here inhaling stretched to almost five seconds, described as an early sign of respiratory obstruction or airway narrowing (10).
Variability. Breathing-rate variability (RRV) is the natural variation in how long each breath lasts, from one breath to the next. Early in Rod's case it was higher, showing his breathing could still adapt; over time it fell significantly, suggesting the body was losing its ability to respond to changing needs (6).
The breathing waveform, a core capability of the XK300, revealed patterns far beyond what a rate alone can show: prolonged pauses, extended inhalations and a loss of variability. These hidden shifts exposed a clear decline in adaptability during the final days.
The radar recorded a steady rise in resting heart rate, from an average of 73 beats per minute on D-14 to 87 by D-2. The values stayed inside the traditional "normal" range throughout. Against his own first five days, though, the change was significant: more than two standard deviations above that average. A spot check or a fixed-threshold monitor would have overlooked these "normal" values; in the continuous record, the deviation from his own baseline is visible six days before his passing.
The pulse-respiration quotient counts how many times the heart beats for every breath. Heart and breathing rates tend to rise together in exercise and fall together at rest; the balance normally sits between 3 and 6, and in published work a widening gap is associated with mortality risk among critically ill patients (11). In Rod's case it rose from 5 to 10 in the final days: the heart beating far faster than breathing could match, a widening gap that the literature associates with growing strain.
Beats per minute. The centre rises and the spread tightens.
Heart rate rose by 16 beats a minute. Still within the printed normal range, it was a significant shift from Rod's own baseline, visible from D-6. Variability narrowed and heartbeats per breath doubled from 5 to 10, showing reduced responsiveness and an abnormal balance between heart and breathing.
Rod's case made the readings tangible, and prompted a larger question: did the same readings shift consistently before death? Across a broader cohort of 338 journeys near the end of life, Xandar Kardian's Probability of Baseline Change (PoBC) was used to mark meaningful shifts in the days leading up to death.
PoBC establishes each person's usual distribution of resting heart rate and breathing rate, then tracks how far new readings deviate from that baseline, on a scale from −100 (dropping) through 0 (stable) to +100 (rising). It reflects both the size of a change and its direction, helping to separate ordinary variation from a significant shift.
When PoBC rose above +95 or fell below −95 for heart rate or breathing rate, it marked a clear shift from the person's baseline, beyond routine variation. Applying those thresholds across the cohort, retrospectively, gave the results on the right.
Probability of Baseline Change: how far today's resting readings sit from the person's own usual, and in which direction.
Retrospective. The February 2026 methodology update, across 390 journeys, reported an average of 6.3 days. See the full outcomes table.
In these records, subtle changes were visible while vital-sign readings still appeared within normal ranges, on average more than five days before death. On the Kardian dashboard, changes from a person's own baseline are shown to the care team as interpretable, configurable notifications. What follows is what such a window could mean, drawn from the white paper; it is not a claim about what any product will do for a given person.
Those extra days create space for presence: to share last conversations, to be physically at the bedside, and to enter the final days prepared rather than surprised. The difference is measured not only in time but in the quality of closure it makes possible.
Seeing a change sooner offers a chance to adapt care plans in step with decline. Subtle shifts in breathing or heart rate can prompt timely adjustments in medication, additional comfort measures and clearer communication with families. Care teams can anticipate needs instead of reacting to them.
Foresight strengthens both care and sustainability. Continuous monitoring reduces the burden of manual checks, lets staff focus where they are most needed, and opens access to existing reimbursement pathways.
At XK we are building on the lessons of Rod's case and many other end-of-life cases, studying how continuous readings can be distilled into clear, interpretable notifications. The aim is timely, accurate insight that helps clinicians anticipate decline and guide care with confidence. This remains research: no product detects or predicts death, and none is cleared to.
Xandar Kardian white paper, 2025. Cover image and bedside photograph are illustrative and do not depict actual patients or events. Retrospective; part of ongoing discovery and research; not a cleared indication. XK does not predict or diagnose health events.